7.2 KiB
Debugging with Eclipse and J-Link
This topic explains how to setup and use MCU Eclipse with a Segger Jlink adapter to debug PX4 running on NuttX (e.g. Pixhawk series boards).
필요한 하드웨어
- J-Link EDU Mini
- Adapter to connect Segger JLink to Flight Controller SWD Debug Port (debug port).
- Micro USB 케이블
설치
PX4
일반 지침에 따라 PX4를 설정합니다.
- Setup the PX4 Developer Environment/Toolchain for your platform (e.g. for Linux see: Development Environment on Ubuntu LTS / Debian Linux).
- Download PX4 and optionally build it on the command line.
Eclipse
To install Eclipse:
- Download Eclipse CDT for C/C++ Developers (MCU GitHub).
- Eclipse 폴더의 압축을 풀고 적당한 폴더에 복사합니다(설치 스크립트를 실행할 필요가 없음).
- Run Eclipse and choose a location for your initial workbench.
Segger Jlink 도구
To install the Segger Jlink tools:
- Download and run the J-Link Software and Documentation Pack for your OS (Windows and Linux packages available).
- On Linux the tools are installed in /usr/bin.
For more information, see: https://gnu-mcu-eclipse.github.io/debug/jlink/install/.
첫 사용
-
Connect the Segger JLink to the host computer and the flight controller debug port (via an adapter).
-
비행 콘트롤러에 전원을 공급합니다.
-
Run Eclipse.
-
Add a source by choosing File > Import > C/C++ > Existing Code as Makefile Project and click Next.
-
Point it to the PX4-Autopilot folder and give it a name, then select ARM Cross GCC in the Toolchain for Indexer Settings and click Finish. 가져오기는 시간이 걸리며, 완료될 때까지 기다립니다.
-
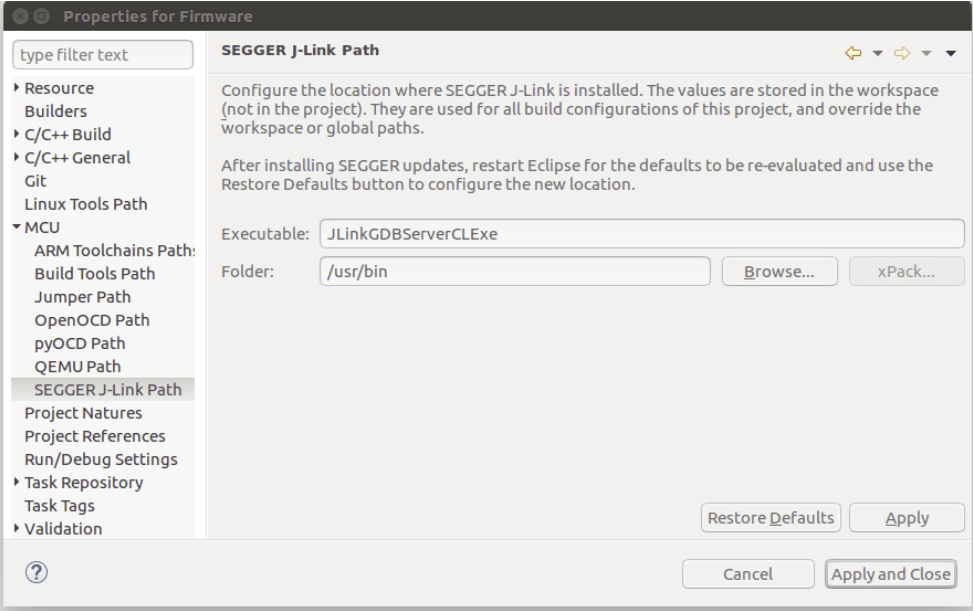
Set the MCU settings: right-click on the top-level project in the Project Explorer, select Properties then under MCU choose SEGGER J-Link Path. 아래 스크린샷과 같이 설정합니다.
-
패키지를 업데이트합니다.
-
Click the small icon on the top right called Open Perspective and open the Packs perspective.

-
Click the update all button.
:::tip This takes a VERY LONG TIME (10 minutes). 누락된 패키지에 대한 오류를 무시하십시오.
-
:::

- The STM32Fxx devices are found in the Keil folder, install by right-clicking and then selecting install on the according device for F4 and F7.
-
대상에 대한 디버깅 설정을 진행하십시오:
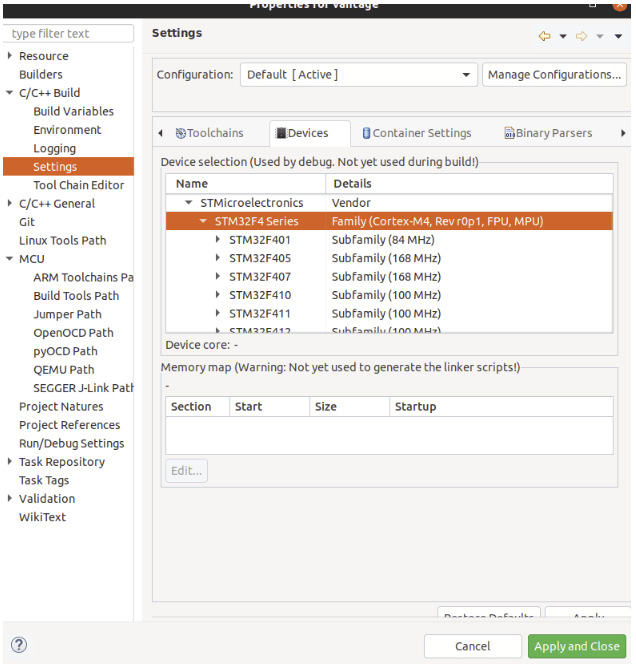
- Right click project and open the Settings (menu: C/C++ Build > Settings)
- Choose the Devices Tab, Devices section (Not Boards).
- 디버그하려는 FMU 칩을 찾으십시오.
-
Select debug configurations with the small drop-down next to the bug symbol:
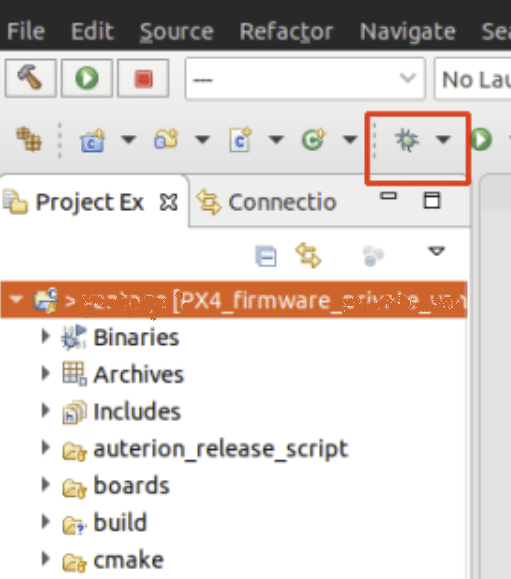
-
Then select GDB SEGGER J-Link Debugging and then the New config button on the top left.

-
빌드 구성을 설정합니다.
-
Give it a name and set the C/C++ Application to the corresponding .elf file.
-
Choose Disable Auto build
::: info Remember that you must build the target from the command line before starting a debug session.
-
:::

-
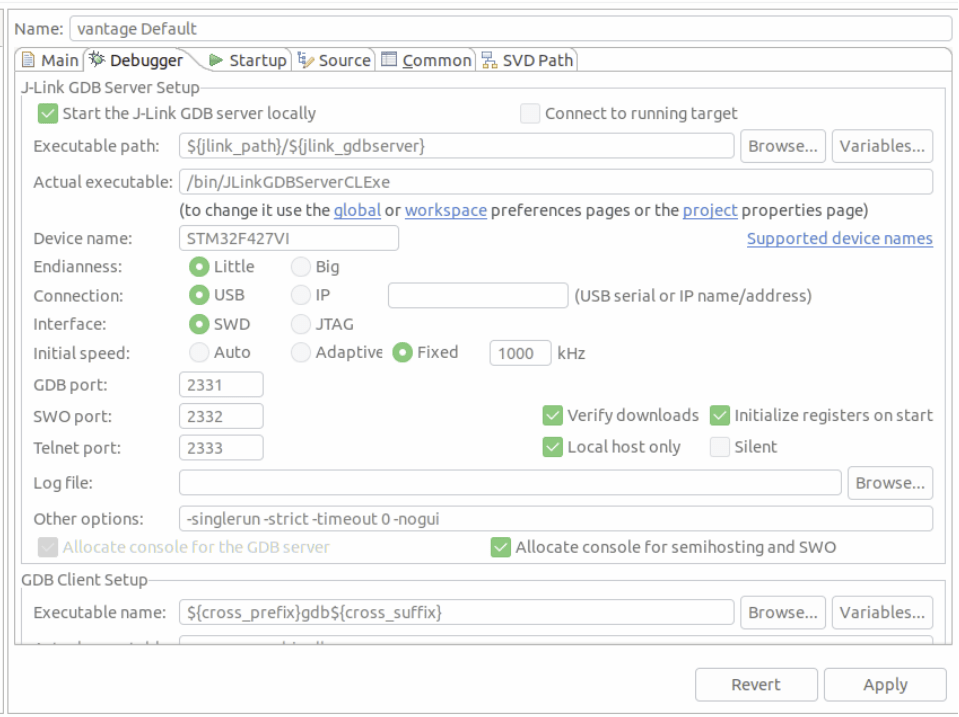
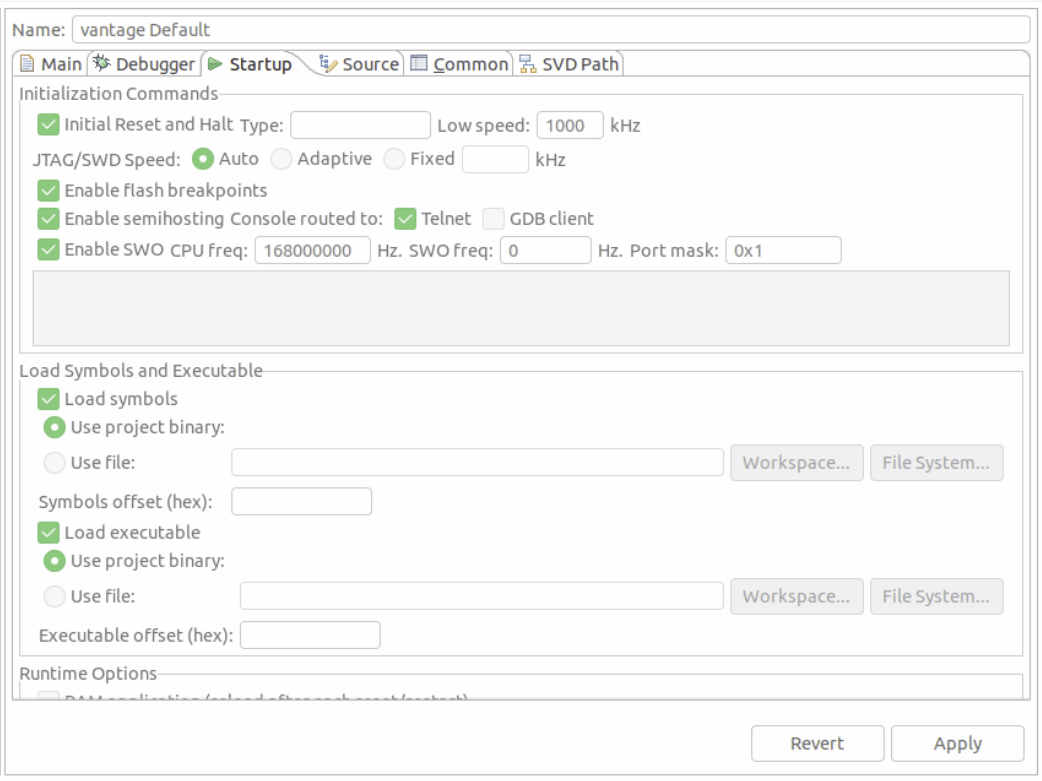
The Debugger and Startup tabs shouldn’t need any modifications (just verify your settings with the screenshots below)
SEGGER Task-aware debugging
Task-aware debugging (also known as thread-aware debugging) allows you to show the context of all running threads/tasks instead of just the stack current task. This is quite useful since PX4 tends to run many different tasks.
To enable this feature for use in Eclipse:
-
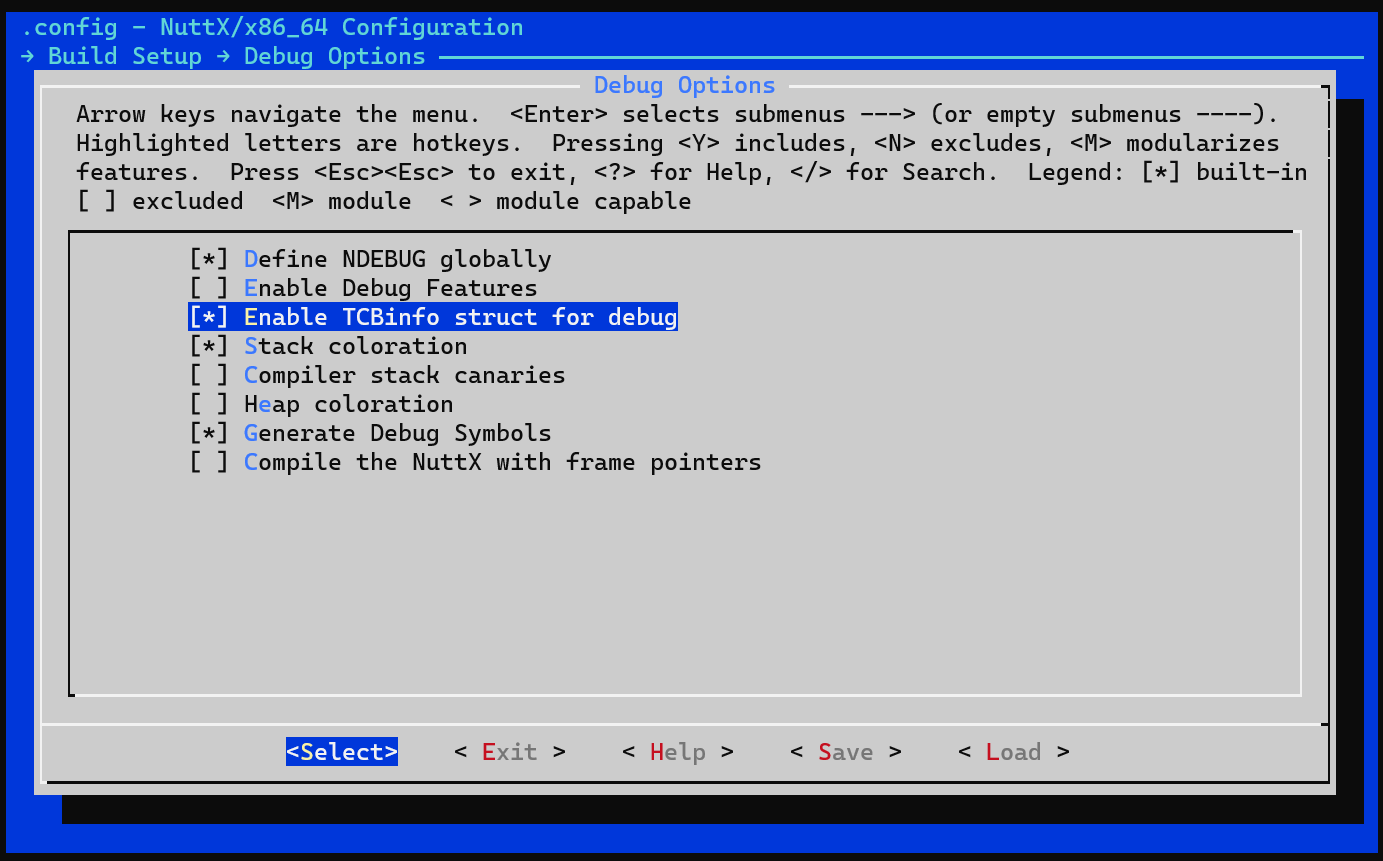
You first need to enable
CONFIG_DEBUG_TCBINFOin the NuttX configuration for your build (to expose the TCB offsets).-
Open a terminal in the root of your PX4-Autopilot source code
-
In the terminal, open
menuconfigusing the appropriate make target for the build. This will be something like:make px4_fmu-v5_default boardguiconfig(See PX4 Menuconfig Setup for more information) on using the config tools).
-
Ensure that the Enable TCBinfo struct for debug is selected as shown:
-
-
Compile the jlink-nuttx.so library in the terminal by running the following command in the terminal:
make jlink-nuttx -
Modify Eclipse to use this library. In the J-Link GDB Server Setup configuration, update Other options to include
-rtos /home/<PX4 path>/Tools/jlink-nuttx.so, as shown in the image below.
-
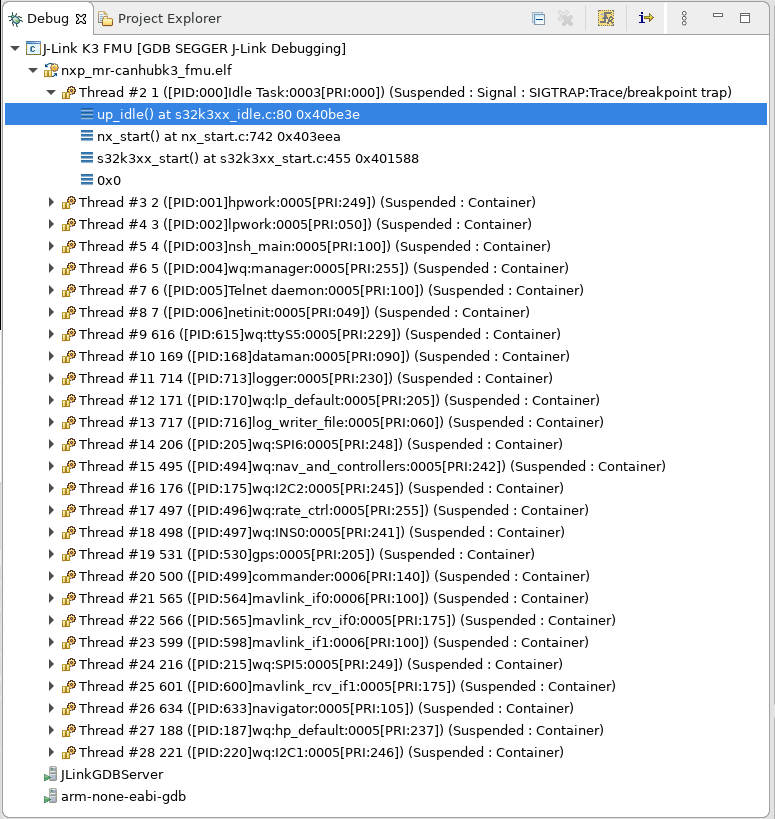
When running the debugger you should see now multiple threads instead of just one:
문제 해결
패키지 관리자에 없는 대상 CPU
대상 CPU가 패키지 관리자에 표시되지 않으면, 레지스터 보기가 작동하도록 하려면 다음 단계가 필요할 수 있습니다.
:::tip This should not generally happen (but anecdotally has been reported when connecting to an STM F7 controller). :::
Adding missing SVD files for the Peripheral View:
-
Find out where MCU Eclipse stores its packages (Preferences > C/C++ > MCU Packages):
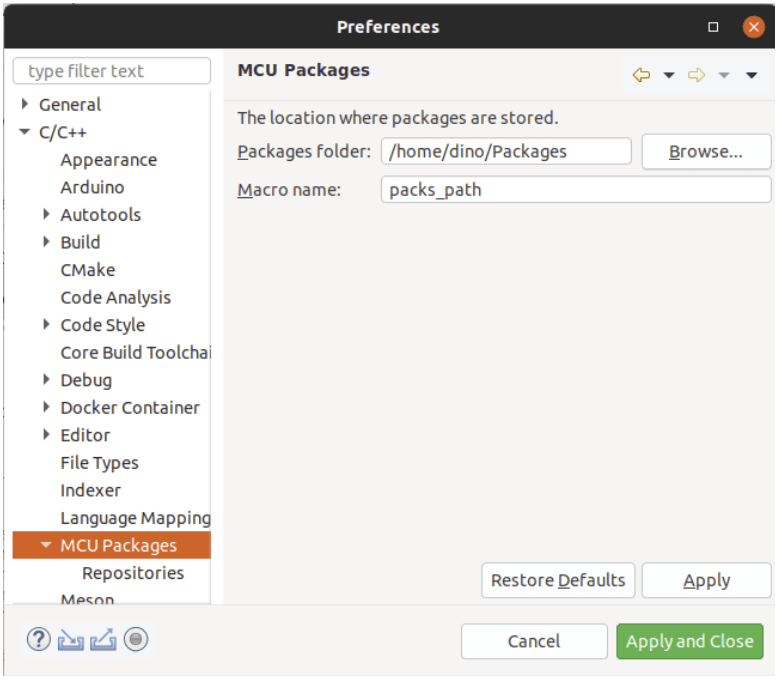
-
Download missing packages from: https://www.keil.arm.com/devices/
-
Open downloaded pack with a decompression tool, and extract the .SVD files from: /CMSIS/SVD.
-
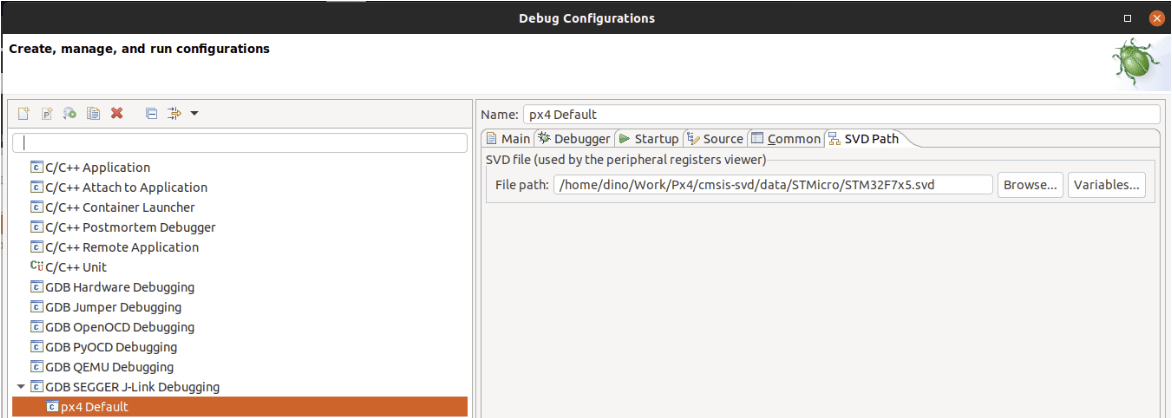
Select desired .SVD file in: Debug Options > GDB SEGGER JLink Debugging > SVD Path